November 24, 2025
•
Flarelight Team
Data Analysis Tools: Understanding When to Use Each Tool (Not Which is Better)
SQL, Python, Excel, Power BI, and Flarelight aren't competitors—they're complementary tools. Learn when to use each tool in your data analysis workflow and why the best analysts combine them effectively.
Data Analysis Tools: Understanding When to Use Each Tool (Not Which is Better)
I keep seeing comparisons pitting SQL against Python, Excel against Power BI, or Flarelight against Tableau as if they're interchangeable alternatives. But that's a fundamental misunderstanding of how data analysis actually works in practice.
The truth is: not all tools are meant to compete—some are meant to work together.
The best data analysts don't pick one tool and stick with it. They understand that each tool serves a distinct purpose in the data lifecycle, and they combine them effectively to get the job done.
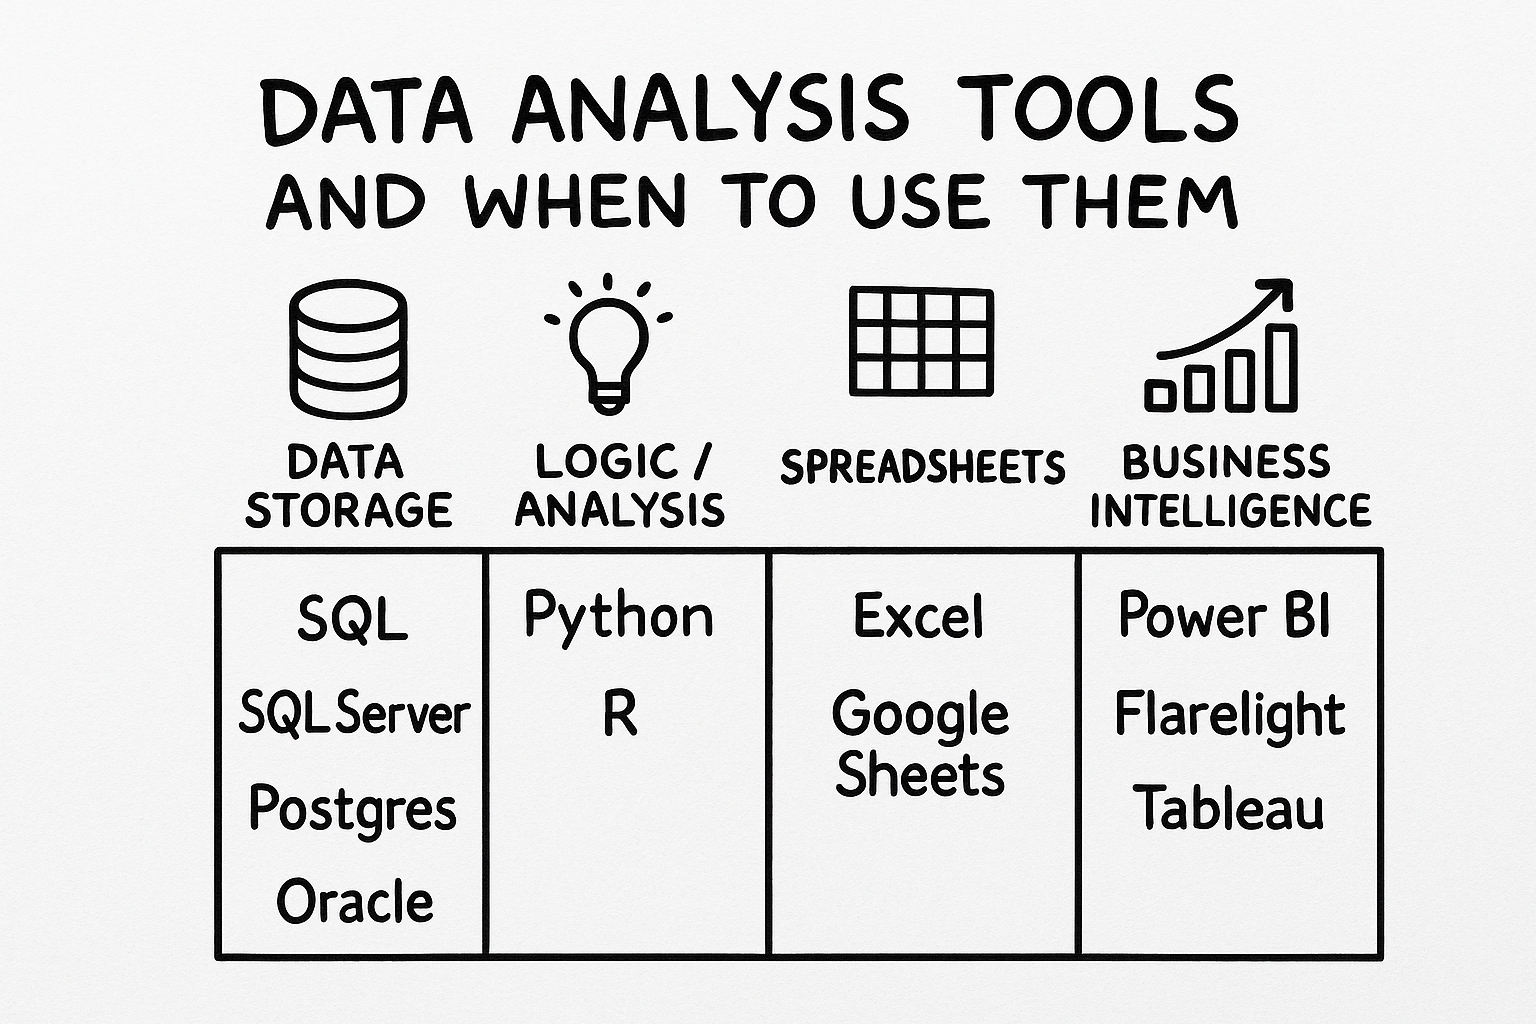
The four categories of data analysis tools and when to use each one.
The Four Categories of Data Tools
Data analysis tools fall into four main categories, each with a specific role:
1. Data Storage: Databases and Query Languages
Tools: SQL, SQL Server, PostgreSQL, Oracle, MySQL
What they are: SQL isn't a programming language—it's a query language designed to talk to databases. It's optimized for fetching and manipulating large datasets efficiently.
When to use them:
- Storing and managing large volumes of structured data
- Performing complex joins and aggregations across multiple tables
- Handling transactional data that requires ACID compliance
- Serving as the foundation for other tools to connect to
Why they matter: Try loading a few hundred million rows into memory with Python or Excel, and you'll quickly see why databases exist. They're built to handle data at scale efficiently.
Key insight: Databases are the foundation. Most other tools connect to them to access data.
2. Logic and Analysis: Programming Languages
Tools: Python, R
What they are: Python and R are programming languages—they're great for logic, analysis, and modeling, but they don't replace a database.
When to use them:
- Statistical analysis and data modeling
- Machine learning and predictive analytics
- Custom algorithms and complex calculations
- Data transformation and ETL processes
- Reproducible research and analysis scripts
Why they matter: When you need to implement custom logic, run statistical tests, or build machine learning models, programming languages give you the flexibility and power you need.
Key insight: Python and R excel at analysis and logic, but they typically pull data from databases rather than storing it themselves.
3. Spreadsheets: Quick Exploration and Small-Scale Analysis
Tools: Excel, Google Sheets
What they are: Excel and Google Sheets aren't BI tools—they're spreadsheets. But they're incredibly capable for quick exploration and small-scale analysis.
When to use them:
- Quick data exploration and ad-hoc analysis
- Small datasets (typically under 1 million rows)
- Collaborative work where multiple people need to edit
- Simple calculations and pivot tables
- Data entry and manual data collection
- Sharing data with non-technical stakeholders
Why they matter: Sometimes you just need to quickly explore a dataset, make a simple calculation, or share data in a format everyone understands. Spreadsheets are perfect for this.
Key insight: Spreadsheets are great for small-scale work and collaboration, but they're not designed to be enterprise BI platforms.
4. Business Intelligence: Visualization and Interactive Analysis
Tools: Power BI, Tableau, Flarelight, Qlik, Looker
What they are: True BI tools—built to connect to or import data from multiple sources, and then leverage powerful databases behind the scenes to let you explore, visualize, and share insights interactively.
When to use them:
- Creating interactive dashboards and reports
- Connecting to multiple data sources (databases, APIs, files)
- Sharing insights with business stakeholders
- Self-service analytics for non-technical users
- Automated reporting and scheduled updates
- Data visualization at scale
Why they matter: BI tools bridge the gap between raw data and business insights. They make it possible for business users to explore data without writing SQL or Python code.
Key insight: BI tools are the presentation layer—they connect to your data sources and make insights accessible to everyone.
How These Tools Work Together
The most effective data workflows combine multiple tools:
- Data Storage (SQL/Databases) → Store and manage your data
- Analysis (Python/R) → Perform complex analysis and modeling
- Quick Exploration (Excel/Sheets) → Rapid prototyping and small-scale work
- Business Intelligence (Flarelight/Power BI/Tableau) → Visualize and share insights
A Real-World Example
Here's how a typical workflow might look:
- Data is stored in a SQL database (PostgreSQL, SQL Server, etc.)
- A data scientist uses Python to build a predictive model and writes the results back to the database
- A business analyst uses Excel to quickly explore a sample of the data and validate assumptions
- A BI platform like Flarelight connects to the database, imports the data, and creates interactive dashboards
- Stakeholders access the dashboards through Flarelight to make data-driven decisions
Each tool does what it's best at, and they all work together seamlessly.
Why Flarelight Fits in Your Tool Stack
Flarelight is designed to work alongside your existing tools, not replace them:
Seamless Integration
- Connect to SQL databases directly—no need to export and import data
- Import from Excel and Google Sheets using the Flarelight DataLink Add-in
- Pull data from APIs and other sources
- Import Python/R outputs as CSV or JSON files
No-Code Approach
While Python and R require programming skills, Flarelight provides a no-code interface that makes data analysis accessible to everyone. Business users can create dashboards and run analyses without writing a single line of code.
AI-Powered Insights
Flarelight's AI can automatically analyze your dashboards and generate insights, recommendations, and summaries—saving time and helping you discover patterns you might have missed.
Automation
Set up automated workflows that run when new data arrives, so your dashboards stay up-to-date without manual intervention. This is especially powerful when combined with Python scripts or database triggers.
Hybrid Deployment
Flarelight works in both cloud and on-premises environments, so you can keep your data where it needs to be while still getting modern BI capabilities.
The Bottom Line
Stop asking "which tool is better?" and start asking "which tool is right for this specific task?"
- Need to store data? Use a database (SQL Server, PostgreSQL, etc.)
- Need to analyze and model? Use Python or R
- Need to quickly explore? Use Excel or Google Sheets
- Need to visualize and share insights? Use a BI tool like Flarelight
The best analysts don't pick one tool—they master multiple tools and know when to use each one. They understand that SQL, Python, Excel, and Flarelight aren't competitors—they're teammates in the data analysis workflow.
Getting Started with Flarelight
Ready to add Flarelight to your tool stack? Start for free and see how it complements your existing data tools.
Whether you're connecting to SQL databases, importing from Excel, or pulling data from APIs, Flarelight makes it easy to turn your data into actionable insights—no coding required.
Learn more about Flarelight's features or check out our tutorial series to see it in action.